

UTILITY BILL ANALYSIS

Many times at the beginning of our search for savings, TRG will initially look at a client’s utility bills. This can help identify if there are any available savings on the Supply or Demand side of their energy costs. The Supply Side savings would be based on what our clients are paying to purchase their energy. The Demand Side has to do with reducing costs associated with energy usage.
TRG will focus on identifying where and how a client is spending their energy dollars and where hard savings can be generated. Utility Bill analysis can be done with low, up-front costs or through shared savings, which may well pay for any future energy improvements.
We start with a single copy of a utility bill from each energy supplier. If we see potential savings, we can look further at a year’s worth of bill data. We breakdown each bill and put the information into a spreadsheet. This data will be analyzed and a report generated to show actual and projected cost reductions.
Based on our 30 years of experience, we typically find savings in a range from 2.5% – 10% or more.
Utility Energy Bill Analysis
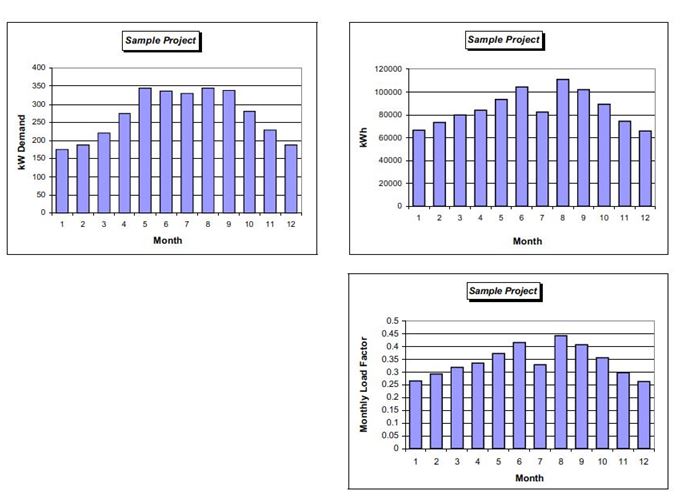
The first step in a TRG energy assessment and evaluation project is to analyze the facility’s historic electric and natural gas bills. TRG has developed different Utility Bill Analysis Programs tailored to match different assessment needs and accommodate various utility rate schedules. The results of these programs include both summary data and graphic depiction of key data.
- Utility Bill Analysis Type #1 takes electric and natural gas utility data and performs a “high-level” analysis that an owner or manager of an office building can readily understand. It generates several graphs to assist in the interpretation of the data.
- Utility Bill Analysis Type #2 combines electric and natural gas utility data with selected survey data and performs an analysis that an owner or manager of an office-building can readily understand. Several graphs are generated to assist in the interpretation of the data. The results obtained with this program are more detailed than those from program #1.
- Utility Bill Analysis Type #3 establishes a “before” (baseline) and “after” view of energy-conservation retrofit opportunities. Using billing review and tracking, it quantifies the persistence savings from the retrofit over any number of years.
- Utility Bill Analysis Type #4 identifies, at a “high-level,” the natural gas usage by the domestic hot water and space-heating systems.
See Charts below as a sample of these programs.

Utility Rates Analysis
There are two ways to save money on energy – use less and pay less. The R Group has formed an alliance with Utilities Analyses, Inc, to offer broadened services for utility billing audits and a superb web-based Utility Tracking Service for easy management and reporting of monthly energy usage by building or facility. Savings guarantees are offered.
Utility Rates Analysis service helps our clients pay less by examining current utility rates to determine if there are better rates and by analyzing utility bills to identify billing errors and simple operational changes to save money. It has been estimated that one percent of utility bills contain errors.
Three Phases
Phase I: Basic Study
- Review 12-24 months gas, electric and water bills
- Develop a strategy to reduce costs and rates
- Make recommendations for follow-up actions to realize savings
Phase II: Study & Results
- Phase I, plus the following
- Work with utility representatives and Owner to implement the strategy
- Coordinate meetings
- Perform analyses
- Prepare strategies
- Negotiate with Utilities to secure savings
- Document savings & continue to monitor
Phase III: Monthly Energy Review
- Ongoing support service to review each month’s utility bills to assure maintenance of savings, to be continually vigilant for new opportunities and to recognize and alert management of excess energy use trends.
The R Group considers alternative rate tariffs for which the Owner’s facility may be qualified (or may become qualified if certain plant-side changes were made), and factors this in to the Energy Audits
Monthly Energy Review – We also offer a Monthly Energy Review service to provide ongoing support services by reviewing each month’s utility bills. All organizations should have an “Energy Manager” but only the largest ones can afford it. For the rest of us, TRG offers a monthly (or quarterly) energy review service that performs the duties of an Energy Manager without the staff position: review utility bills – electric, gas, water, other, compare monthly data to a benchmark and report to you when bills are outside of pre-set boundaries for a “Management by Exceptions” corrective action.
Your Utility Report gives you a Building Report which compares Building Energy Use over time, with appropriate adjustments for weather and occupancy variations, a Comparison Report to compare similar buildings, a Trend Report to reveal patterns over time, an Exceptions Report to identify anomalies and an Issues Report with a checklist to identify specific action items needing attention.
BILL AUDITING CAN HELP YOUR BUSINESS
Ascertain refunds and savings
Based on thousands of client audits for a wide range of services, we typically find at least 15% savings – but often more.
Eliminate financial risk
It’s a win-win. We do not charge fees. We are compensated from a percentage of the results we find when combined with another service
OUR AUDITING PROCESS
- We look at your business in its entirety, examining invoices and service agreements for up to 11 applicable services.
- Next, we review these documents for errors, anomalies, and overcharges during an extensive 30 – 90 day bill audit and verification process. Using proprietary software and system tools to thoroughly analyze every single invoice, we compare your charges against your service agreements, usage demand profiles, and our internal rate database.
- Finally, we meet with your team to submit our recommendations and provide an objective evaluation.
Tips on Analyzing a Utility Bill
- Keep track of your estimated bills.
- Flag bills that are estimated more than one month in succession.
- Call the utility and find out WHY the bill is being estimated.
- Pay particular attention to larger accounts.
- Garbage in – garbage out! Make sure that your utility bill database is set up to accurately record every bill with the correct unit of measure. And remember – you can’t manage what you don’t measure!
- Pay particular attention to natural gas and water, which have multiple units of measure that may vary from vendor to vendor or even account to account.
- Examine your organization’s training processes for utility bill ‘handlers’, and improve training where needed.
- Standardize on a global unit of measure for tracking energy use from multiple commodities across the entire organization.
- The same use value may appear in several different locations on your utility bill.
- Recognize and accurately record charges for generation and distribution (deregulated accounts).
- Consider tracking other utility bill information, such as load factor and demand charges.
- Load factor is just a number—a ratio, and here’s the Load Factor Formula: Load Factor = Monthly kWh/(monthly peak KW Demand * days in billing period * 24 hours)
- Track your load factor monthly for trend analysis. The value should always be between 0 and 1 (or 0-100, if you convert to a percentage). If it’s not, then something is wrong!
- Load factor trends should usually be steady or seasonal.
- Determine a typical load factor for each building type.
- Remember – higher load factor numbers might be a sign of building control problems, or even billing or meter problems.
- Low load factor generally indicates “spikey” use that could be costing your organization big money in demand ratchet charges. Look for equipment problems that might be contributing to the load fluctuations.
- Refers to the ratio of real power flowing through a circuit to apparent power (product of current and voltage).
- Expressed as a dimensionless number between -1 and 1.
- “Sweet spot” for power factor is generally above .8-.9. If power factor dips below 80 or 90 percent, your utility may assess power factor penalties.
- If you observe a problem, discuss the issue with your electrical engineer and utility provider.
- There is real value in matching the rate schedule to the performance aspects of each meter.
- You do have alternative rate options in most cases.
- The utility will seldom tell you which option is in your best interest.
Hopefully these tips have given you some ideas for analyzing your utility bills.
Please contact us for more Information:
Hopefully these tips have given you some ideas for analyzing your utility bills.
Please contact us for more Information:
